The problem
Do 4,334 e-commerce customers naturally fall into distinct behavioral groups — and if so, how many, and what does each group actually look like? No labels, no predefined segments: the structure had to come from the data itself.
Key results
From raw transactions to behavioral features
Starting from 540,000 raw transaction line items, each cleaning step addressed a specific, investigated issue: missing customer IDs, cancelled orders (including one single cancellation of nearly 81,000 units), non-product service charges, and a handful of zero-value promotional items. After cleaning, 396,340 transactions across 4,334 customers remained.
Each customer was then reduced to three behavioral metrics — Recency (days since last purchase), Frequency (number of distinct orders), and Monetary (total spend). Frequency and Monetary were both heavily right-skewed (skewness of 11.95 and 19.56 respectively, driven by a small number of high-volume wholesale-like buyers) and were log-transformed before clustering — essential here, since K-Means relies entirely on distance calculations that large-scale outliers would otherwise dominate.
Choosing the number of segments
With no ground truth to validate against, two independent methods were used to choose K: the elbow method (watching cluster compactness improve as K increases) and the silhouette score (measuring how well-separated and coherent clusters are). The silhouette score pointed clearly to K=3, decreasing steadily for every larger value tested — a consistent signal, not an isolated peak.
Three segments, three business stories
| Segment | Share | Recency | Frequency | Monetary |
|---|---|---|---|---|
| Champions | 30.6% | 30 days | 9.7 orders | $5,374 |
| Mid-value | 46.6% | 55 days | 2.0 orders | $606 |
| At risk / lost | 22.7% | 255 days | 1.4 orders | $407 |
Champions — under a third of customers — spend roughly 9 times more and order 7 times more often than the At-risk segment, despite similar group sizes. Nearly a quarter of the customer base hasn't purchased in the better part of a year, the clearest target for a win-back campaign before they're lost for good.
Seeing the segments: PCA
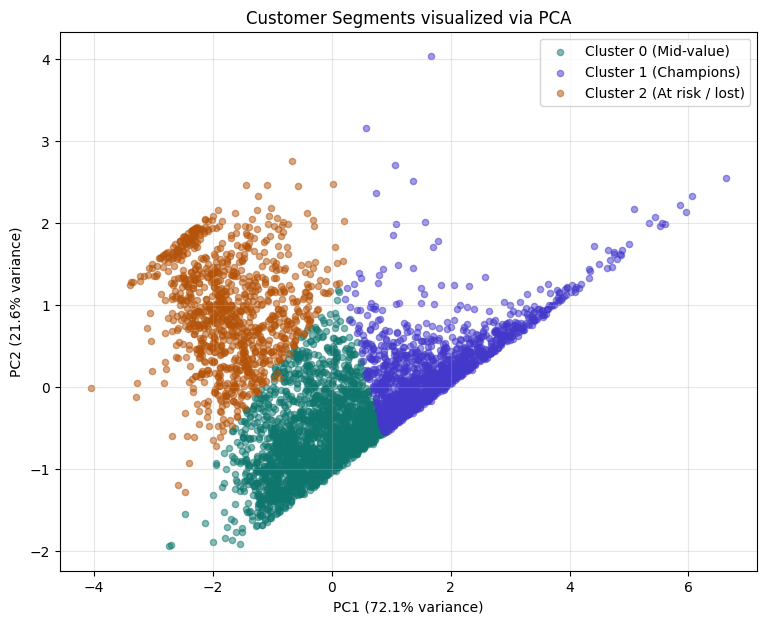
Three behavioral dimensions can't be plotted directly on a 2D chart. PCA compressed them into two components while retaining 93.6% of the original variance. Examining the component loadings gave a clean interpretation: the first component behaves as an overall customer value score (rising with Frequency and Monetary, falling with Recency), while the second captures how currently active a customer is, largely independent of their historical spend.
Cross-validating with a second algorithm
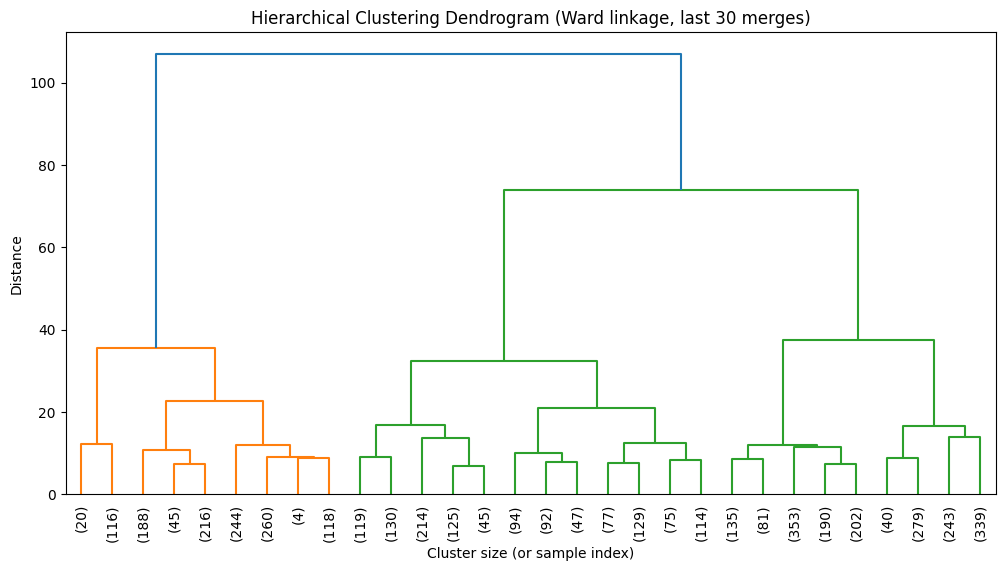
To check whether three segments reflect a genuine pattern rather than an artifact of K-Means specifically, the same data was independently clustered using hierarchical clustering (Ward's method) — an algorithm that never uses centroids or iterative reassignment. Both methods converged on closely matching segment profiles, a strong signal that the structure is real, not a quirk of one particular algorithm.