The problem
Can indoor temperature and humidity readings, combined with outdoor weather data and the time of day, predict how much energy a household's appliances are consuming? Nearly 20,000 measurements from a real home in Belgium, collected every 10 minutes over 4.5 months, were used to find out.
Key results
Why the target needed a log transform
Appliance energy consumption is heavily right-skewed (skewness = 3.39): most readings are low, with occasional large spikes. Training directly on raw watt-hours would let those spikes dominate the error metrics. A log1p transform compresses the long tail, and predictions are converted back to watt-hours for interpretation.
Feature engineering
Raw timestamps aren't usable by a model directly. Time-based features were engineered instead:
- Cyclical hour/day encoding (sine/cosine) — so 11 PM and midnight are correctly treated as close together
- NSM (seconds since midnight) — a continuous alternative that tree-based models can exploit directly
- Weekend flag and month — to capture routine-based consumption patterns
Model comparison
Four modeling approaches were compared on identical train/test splits, evaluated with MAE, RMSE, and R² on both the log and original (Wh) scale.
| Model | R² (log scale) | MAE (Wh) |
|---|---|---|
| Linear Regression | 0.309 | 43.64 |
| Ridge | 0.309 | 43.64 |
| Lasso | 0.308 | 43.54 |
| Random Forest | 0.733 | 27.65 |
All three linear models converged to nearly the same ceiling (R² ≈ 0.31), regardless of regularization. Random Forest broke through that ceiling by capturing non-linear interactions the linear models structurally couldn't — direct confirmation that the underlying relationship in the data is non-linear, not just noisy.
Validating feature selection two different ways
The dataset includes two randomly generated "trap" variables with no real predictive value, deliberately included by the dataset's authors as a control. Two independent methods — Lasso regression (which can zero out coefficients entirely) and Random Forest's feature importance — both correctly ranked these variables as irrelevant, providing cross-validated confidence in the feature selection process.
Where the model struggles
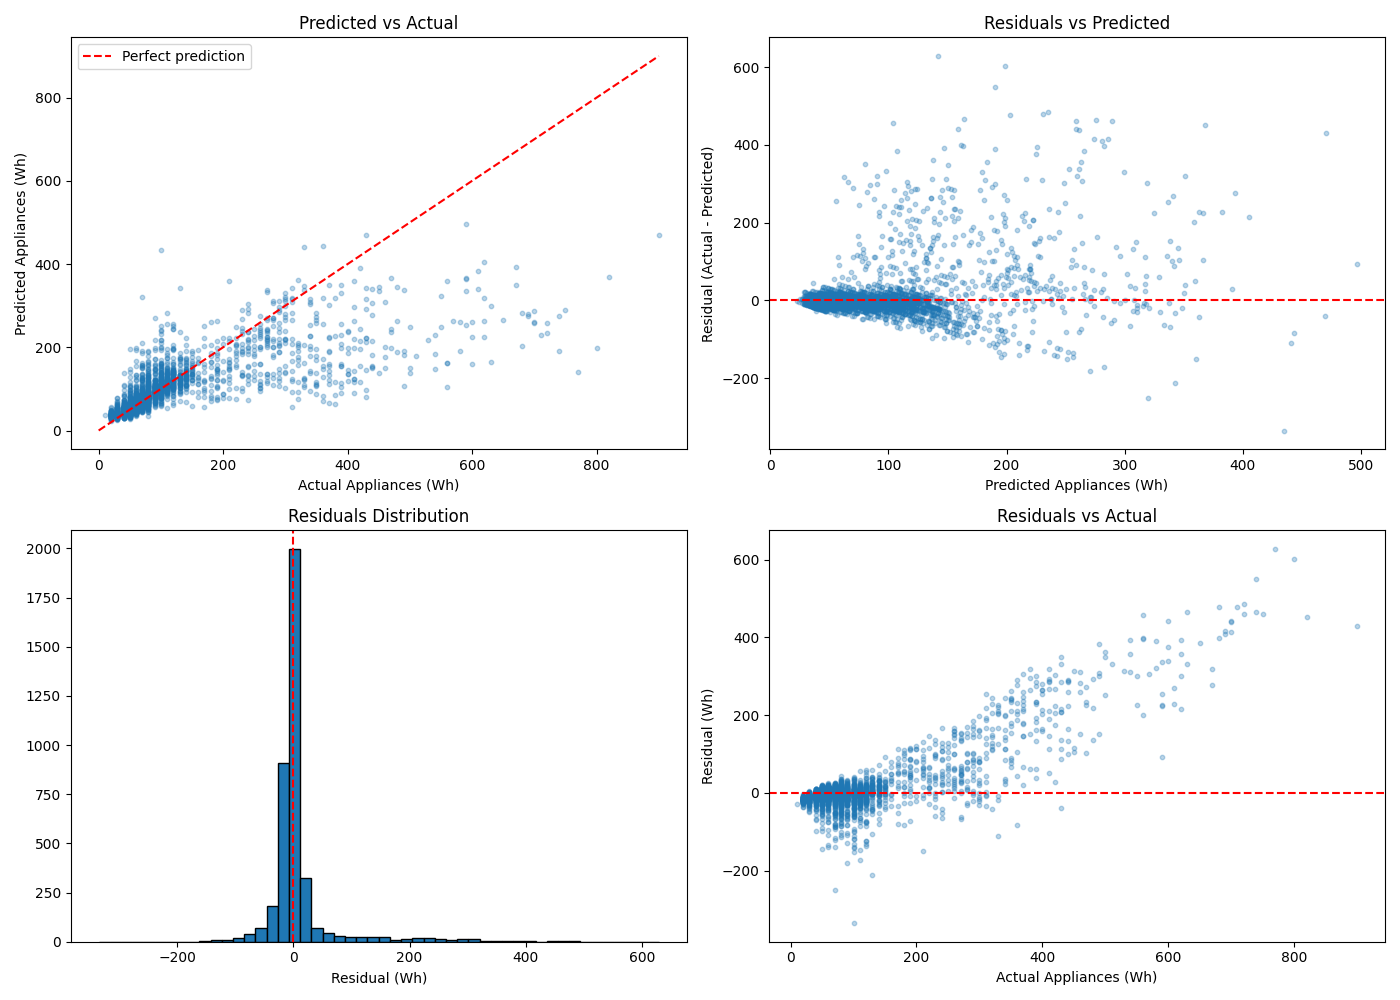
Residual analysis showed a median error of just -1.18 Wh — near-perfect on typical, everyday readings. The mean error (10.15 Wh) and a wider standard deviation (65.78 Wh) tell a different story: a small number of large consumption spikes account for most of the remaining error. This is an expected limitation — appliance usage ultimately depends on human behavior that sensors alone can't fully capture — and matches exactly what the initial data exploration predicted.