The problem
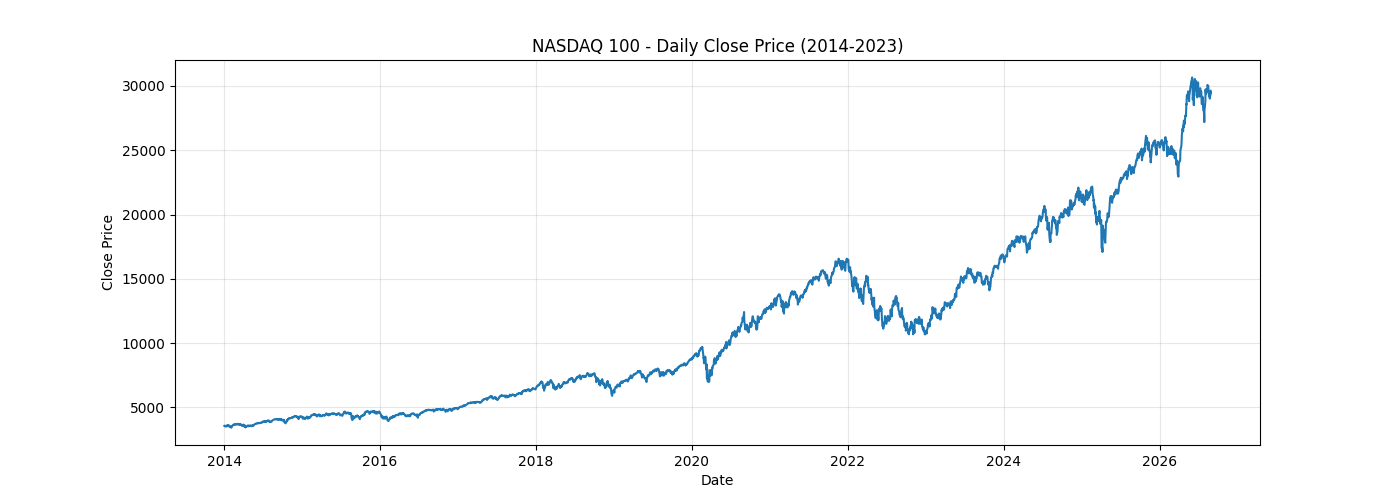
Can three fundamentally different forecasting approaches predict the NASDAQ 100 index roughly 20 months into the future? 12.5 years of daily closing prices (2014–2026) were used to train and test ARIMA, Prophet, and a Random Forest fed with time-based features.
Key results
Why time series break the usual rules
Unlike every other project in this series, row order matters here — shuffling the data would destroy the signal being modeled. The train/test split was drawn at a fixed calendar date (everything before January 2025 for training, everything after for testing) rather than the random splits used elsewhere, and features had to be built by looking strictly backward in time.
An Augmented Dickey-Fuller test confirmed the raw price series was non-stationary (p-value = 0.997) — expected, given the visible long-term uptrend. First-order differencing resolved this (p-value ≈ 0.0000), while also revealing a secondary pattern: volatility clearly increased in the more recent portion of the data, a limitation acknowledged but not corrected for.
Three models, three philosophies
| Model | MAE | RMSE | MAPE |
|---|---|---|---|
| Prophet | 1,257 | 1,631 | 5.52% |
| Random Forest (recursive) | 3,719 | 4,565 | 14.24% |
| ARIMA(5,1,0) | 3,795 | 4,642 | 14.53% |
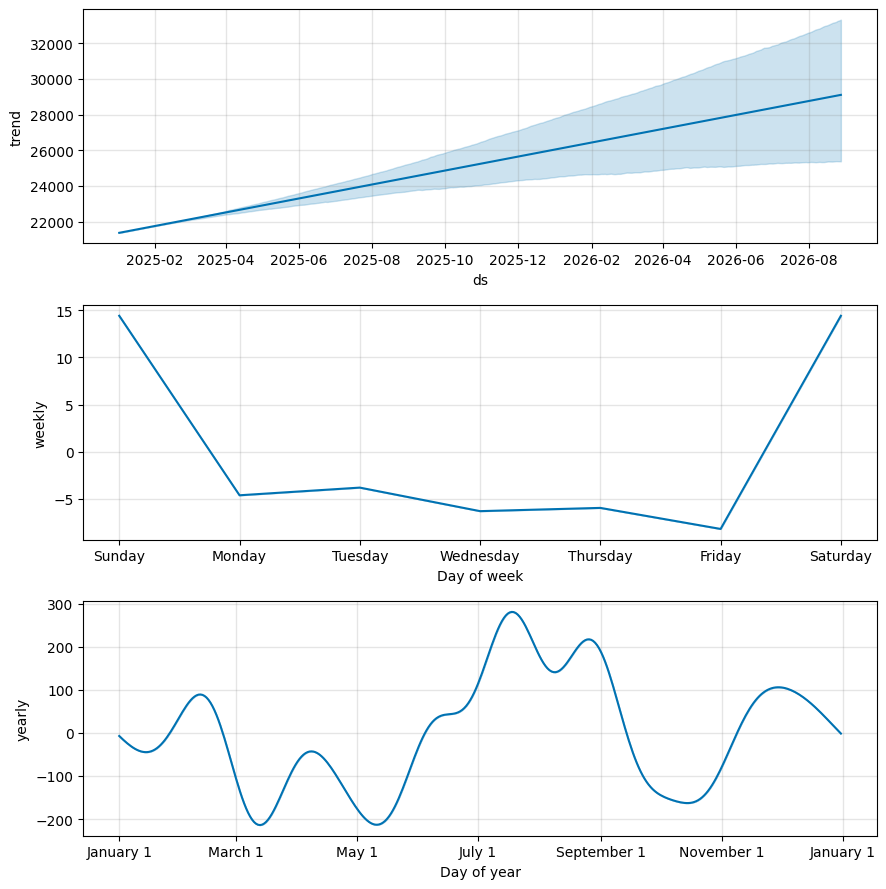
Prophet won decisively — not marginally, but by roughly a factor of three across every metric.
Why the two "losers" failed identically
The most interesting finding wasn't that Prophet won — it was how ARIMA and Random Forest failed. Both flattened into a near-constant forecast, hovering near the last training value, while the actual index climbed to new highs throughout the test period.
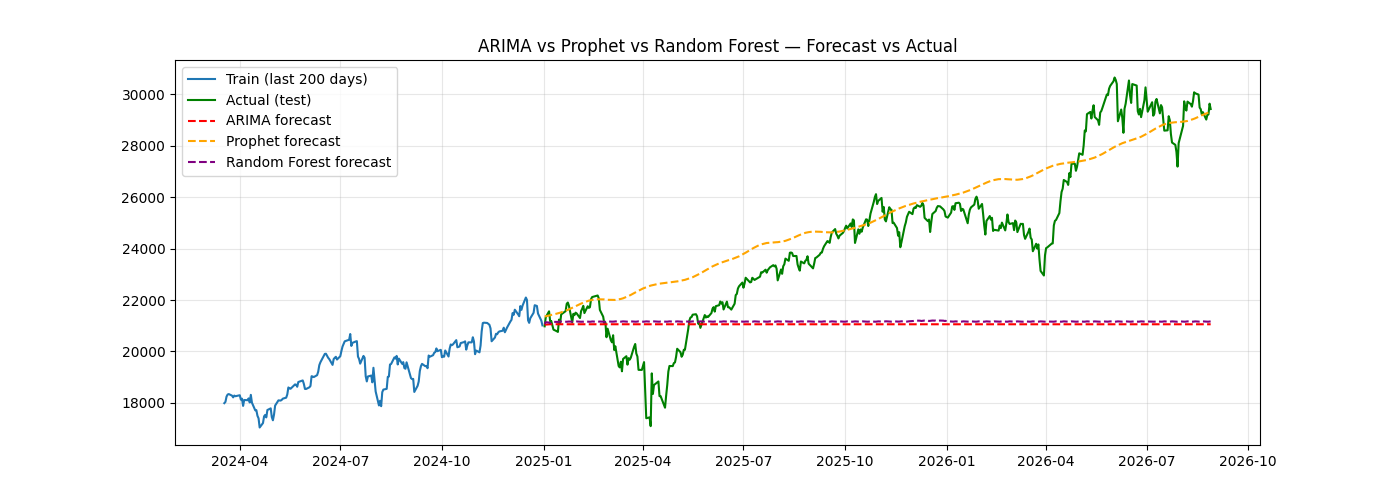
ARIMA's autoregressive coefficients were small and mostly statistically insignificant, so its multi-step forecast mathematically converged toward a flat line. Random Forest's failure had a different root cause: tree-based models learn decision thresholds from the range of values seen in training, and once the recursive forecast pushed prices beyond the historical maximum, the model had no learned basis for extrapolating further — trees are strong interpolators but structurally poor extrapolators.
Prophet's edge wasn't superior sophistication — it was the only one of the three with an explicit, projectable trend component, capable of extending beyond values seen during training.